
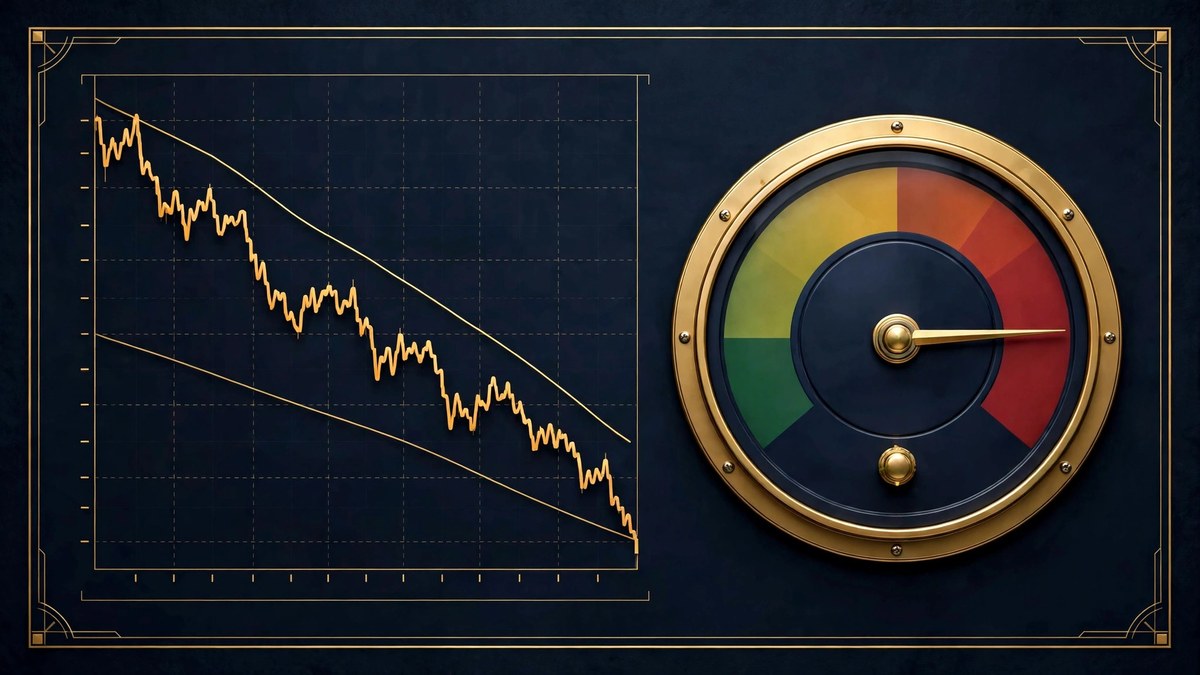
If you want one number that sums up how fast this market turned, here it is: 90 to 20, in less than four weeks. Bitcoin bull score 20 200-day is the story of CryptoQuant’s Bull Score Index, which measures the technical and on-chain strength of the market — and it just collapsed from 90 on October 13 to 20 on November 10, its lowest reading since April 2025.
The last time the score was this low, the market was selling off on US tariff fears. What followed then is worth remembering: the index bottomed at 20, consolidated, and recovered 80 points over about two months as the market found its floor. CryptoQuant is careful to say the reading doesn’t automatically mean Bitcoin keeps falling. But it is equally clear about what it does mean: nearly every indicator it tracks has turned bearish at the same time, and that has not happened often.
The technical picture is just as stark. Bitcoin has fallen below its 365-day moving average of $76,400, which CryptoQuant calls a bearish signal in its own right. That leaves the 200-day moving average, near $73,200, as the next important support — the line the firm says separates a shallow correction from a deeper one. Bitcoin has spent the week fighting over it, dipping to $72,727 on Tuesday before buyers dragged it back above.
In this article
Bitcoin bull score 20 200-day — the stablecoin drain behind the crash
The score didn’t fall on price action alone. The money is leaving too. Tether’s USDT market capitalization has dropped $6.6 billion over the past 60 days — a bigger contraction than the one that followed the FTX collapse in December 2022. Bitcoin demand has plunged by 284,000 BTC, and the Coinbase Premium Index has now spent 30 straight days in negative territory, meaning Americans are paying less for Bitcoin than the rest of the world. That is not dip-buying behaviour. That is distribution.
Add it up and the damage is hard to miss: Bitcoin is down 9% over 30 days and 15% below its September peak of $87,400. The selling pressure, according to CryptoQuant, comes from a mix of profit-taking after the September rally, the Fed’s hawkish turn, the Binance security incident, and the fallout from the US midterm elections. No single villain — a pile-up.
So is this the bottom, or the start of something worse?
Honestly, the data cuts both ways, and that is what makes this week so tense. On the bearish side: the score is at 20, the stablecoin supply is shrinking, the ETFs are net sellers, and one trader after another is pointing out that there is very little real demand between roughly $73,500 and $66,700. If the 200-day line breaks and holds below, the air underneath is thin.
On the other side: the April 2025 precedent, when the same score of 20 marked something close to a bottom rather than the middle of a collapse. The RSI is near 33, edging toward oversold. And Glassnode’s latest report notes that leverage has been flushed and large wallets have begun accumulating — the classic setup for a floor, even if nobody can say exactly when it holds.
For regular holders, the practical read is simple: $73,200 is the line that decides what this correction is. Above it, five red weeks are a correction inside a bull market. Below it, the conversation changes completely — and the Bull Score will have been right to crash first.
The levels above matter too. The 100-day moving average sits near $77,400, and that is the first real resistance if Bitcoin does bounce — a long way from $73,200, which is why the market feels so heavy. Between here and there is a lot of empty chart. What decides it in the next few days is the calendar: Friday’s PPI, the last inflation print before December, and the Fed’s October meeting minutes on November 18, which will show how divided the committee really is about hiking again. Until one of those prints lands, the 200-day line is the whole trade. Every daily close above it is a small win for the bulls. Every close below it hands the argument to the bears — and the Bull Score, sitting at 20, has already picked its side.
Sources: FXStreet: Bitcoin Bull Score Falls to 20 as USDT Supply Shrinks — CryptoQuant; Crypto-Economy: Bitcoin Demand Plunges 284,000 BTC as $6.6B Exits USDT Market Cap.
This article is for education only — not financial advice. Crypto is volatile, so do your own research before buying anything.




Leave a Reply