
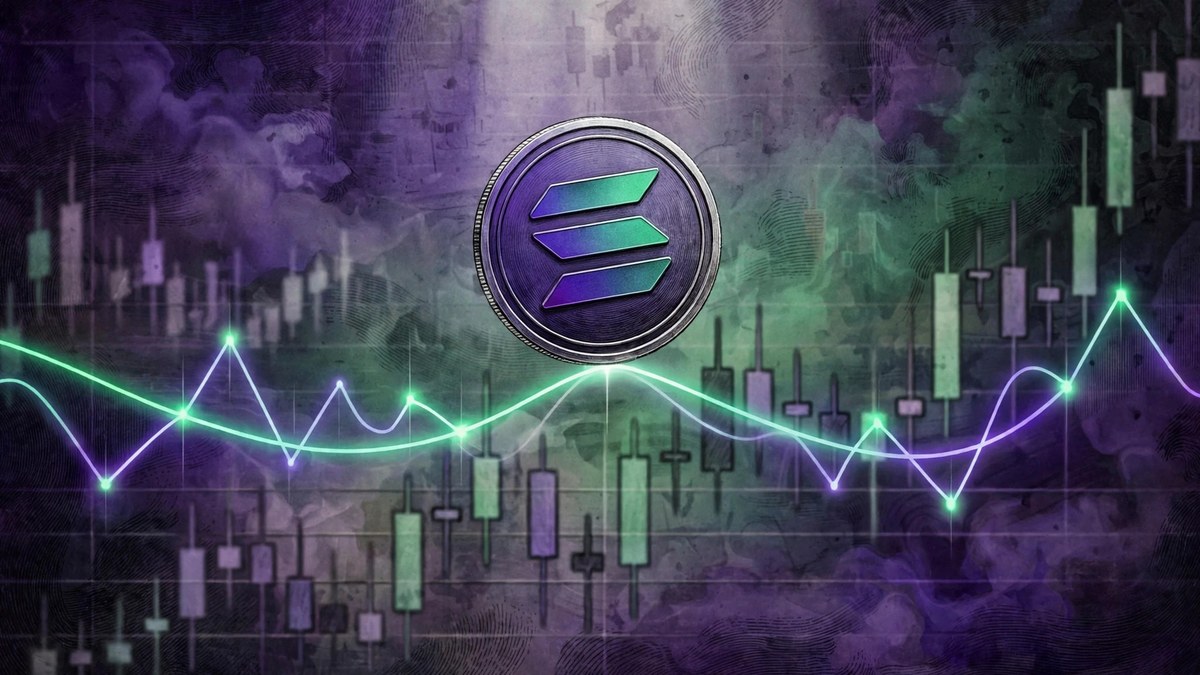
Solana spent Friday sitting on a line it hasn’t touched in months. SOL fell to about $89.36 on Thursday, November 5, with a daily low of $88.83 — right on top of its 200-day moving average of $88.93. It’s the first time since August that Solana has even come close to that line. And in a week where everything in crypto is falling, the Solana 200-day moving average is suddenly the number every SOL holder is watching.
By Friday, SOL was trading around $89.82, down about 6% in 24 hours. That’s a two-month low. And unlike the last few dips, this one isn’t about anything Solana did wrong.
In this article
What the Solana 200-day moving average is
Let’s keep this simple. The 200-day moving average is just the average closing price of SOL over the last 200 days. Traders treat it as the dividing line between a long-term uptrend and a long-term downtrend. Above it, the trend is still your friend. Below it, the story changes.
Solana hadn’t closed below that line since August 21. Every single daily price since August 20 had stayed above it. So Thursday’s dip to $88.83 wasn’t just another red day — it was the first real test of a level that has held for nearly three months.
The rest of the chart looks rough too. SOL is about 69% below its all-time high of $293.31. The RSI, a momentum gauge, sits near 31 — just above the “oversold” line of 30. And the token is trading below its 50-day, 100-day, and 200-day averages all at once. When everything lines up like that, technicians start talking about a “death cross” and downside targets near $70.58 if the $87.21 support level breaks.
None of that is a prediction. It’s a weather report. And the weather is bad.
Why SOL is down this week
Here’s the thing: almost none of this is Solana’s fault. The drop came from outside — the selloff in AI and chip stocks that dragged the Nasdaq down 5.5% and pulled Bitcoin below $76,000. SOL just fell further than most, because it usually does. It’s a high-beta coin, which is a fancy way of saying it moves more than Bitcoin in both directions.
But Solana has its own headwinds too. US spot SOL ETFs recorded $71.47 million in net outflows in the week ended October 30 — the largest weekly withdrawal since the funds launched, and the fourth straight week of outflows. Thursday added another $1.18 million in outflows. Institutions are not exactly lining up to buy the dip.
Then there’s the hack fallout. The Binance hacker stole around 970,500 SOL on October 29 and has been swapping roughly half of it — about 486,970 SOL, worth $46.4 million — into Bitcoin. That’s real sell pressure from a single wallet, and it doesn’t help that Solana-based lending protocol Loopscale paused all activity on November 5 after a week-long campaign that fired more than 30,000 malicious API requests a day at its vaults.
And on Friday, validators faced a deadline: upgrade to Agave 4.4.1 or risk being forked off the network at epoch 1079, estimated around 1:30 PM UTC. The network itself kept running fine through all of it. The problems were around Solana, not in it.
Breakpoint is the next date on the calendar
If you’re looking for a reason to pay attention to Solana over the next two weeks, it’s Breakpoint. The Solana Foundation’s annual conference runs November 15 to 17 in London, at the Olympia exhibition hall — the first time it’s been held there. Ten days out, the price is sitting on a level that a lot of market participants are watching, and the conference won’t fix that by itself.
History says conferences don’t move prices much, and Breakpoint is no exception — it’s a working meeting, not a catalyst. But it does put Solana in front of developers and investors at a moment when the network needs a good story. The Linux kernel vulnerability warning for validators, the ETF outflows, the hacker selling — all of that fades if the conference delivers something real to talk about.
For now, the level is the story. SOL is testing its 200-day line for the first time since August. Hold it, and the long-term uptrend survives a nasty week. Lose it on a daily close, and the next stop traders are watching is $87.21 — and below that, $70.58. That’s the honest math of where things stand.
This article is for education only — not financial advice. Crypto is volatile, so do your own research before buying anything.

Leave a Reply